Benchmarking shows a building’s relative energy efficiency compared to its past usage, and similar facilities in the same geographic area. Such comparisons may help a building manager grasp potential savings if energy system upgrades were applied. Thousands of buildings are now participating in voluntary and mandatory benchmarking programs. Many have found the process useful, and some may find that it offers a few surprises.
The main goal of such scoring is to inform a facility’s management about the scale of potential savings if it deploys now-common efficiency options, such as LED lighting, variable-speed motor drives, and building-wide energy management systems (EMS). Merely re-commissioning an existing EMS has reaped significant reductions in energy bills and greenhouse gas emissions. The United States Environmental Protection Agency (EPA) states that buildings with a benchmark score of 75 in its Portfolio Manager program may use 35% less energy and cost $0.54 less per square foot to operate than their peers.
Deciding which option(s) may best boost a benchmark score requires an understanding of how a building uses energy, through an audit performed by experienced energy analysts (aka “energy nerds). When a low score merely elicits that small step, it will have done its job. However, many building managers have gone a step further by engaging in demand response and developing on-site power systems such as cogeneration and solar panels.
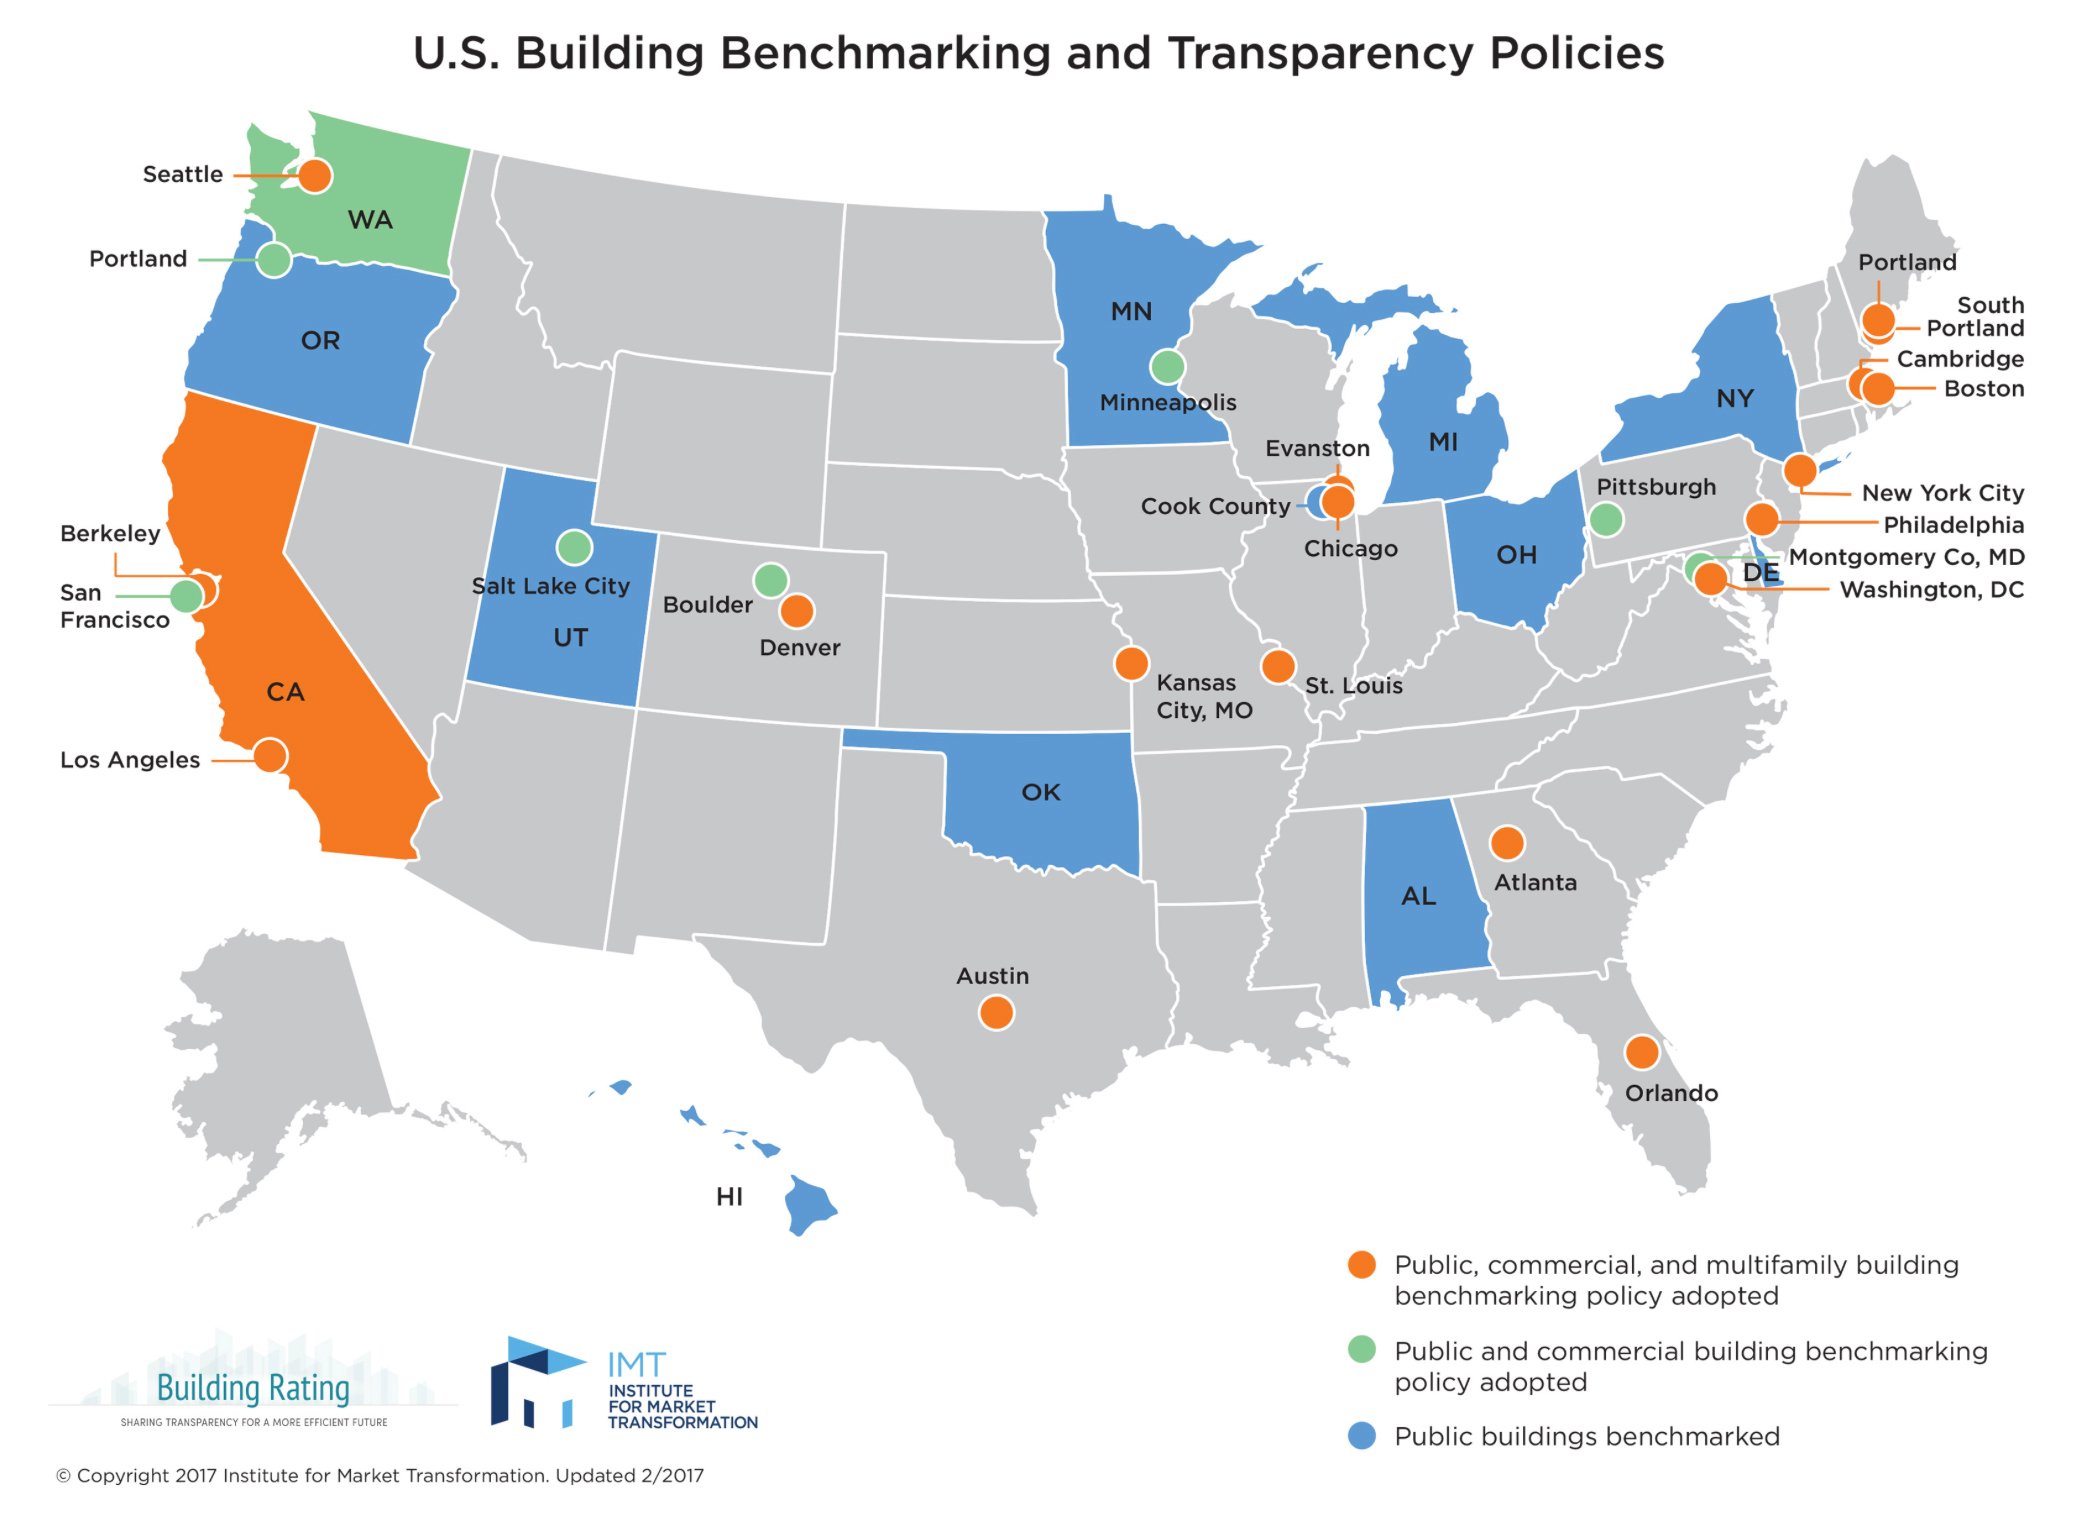
As of early 2017, about two dozen large cities or states (map below) have implemented mandatory energy benchmarking programs for many commercial and institutional buildings, based on square footage and ownership (some apply only to public buildings). Most of those ordinances involve the use of EPA’s Portfolio Manager (PM) program, which has become the U.S. standard for voluntary and mandatory benchmarking.

To compare buildings, PM uses the U.S. Department of Energy’s Commercial Building Energy Consumption Survey (CBECS) database, covering about a million buildings. Every 3 years, it gathers energy data for 17 types of buildings, sorting them based on size, age, purpose, etc.
The result is a set of tables PM uses to develop a percentile curve for each building type. If a particular type, such as a courthouse, uses less energy per square foot than the median for that type in its federal geographic district (e.g., the Northeast), it achieves a score above 50 (on a scale of 1 to 100). Note that a median is not the same as an average. It is based on quantities of entries, not an average of the values of those entries. If a facility manager (or owner, or board of trustees) sees a low score for its facility, it may be urged to apply upgrades to raise it. A building with a score of at least 75 may apply for ENERGY STAR certification and a decal to highlight its success.
As buildings cut their energy use and shift the curve, updating the CBECS database will result in lower PM scores. After August 26, 2018, a typical office building may see its score drop by 12 to 13 points relative to last year’s postings. All past scores will be automatically updated based on the new data, so facilities with a good score, (e.g., 61), may experience “PM shock” if it drops to an unacceptable 49.
Since 2009, New York City’s Local Law 84 (LL84) has driven the benchmarking of buildings with a gross floor area of over 50,000 square feet (10,000 square feet if NYC-operated). The Department of Buildings plans to include benchmarking of mid-size buildings (25,000-50,000 square feet). Facilities are advised to annually check the covered buildings list for their property. Properties on this list must submit data for energy use to the City annually to satisfy law requirements. If the property also has a “Yes” in the “Is this required to report automated water data from DEP?” column, automated data for water use from the Department of Environmental Protection (DEP) must be submitted. Occasionally, there may be a difference between your records and this list. If you believe a property should (or should not) be on the list, email benchmarking@finance.nyc.gov. A property’s status may change yearly, so be sure to review the newest Covered Buildings List annually. A new list is available every February.
To offer additional incentives to improve efficiency, the City publicizes PM scores encouraging those with low scores to act. In 2020, The City will double down on the idea by labeling buildings’ entrances with grades (A-F) reflecting its PM scores.
Visit the ENERGY STAR Buildings & Plants page for free tips to improve scores. For professional guidance on making it actually happen, contact Luthin Associates. We have some of the best “nerds” in the business.


