In recent weeks, between 8 weeks and 11 Liquified Natural Gas (LNG) ships filled their tanks with LNG to transport natural gas from the Gulf of Mexico to markets abroad. On average, each ship carries 3 to 4 Bcf of gas. This equates to approximately 30 and 40 Bcf of gas being exported from the United States every week. Even with all this natural gas leaving the country, record amounts of gas continue to be injected into onshore storage facilities. In fact, in 6 of the last 7 weeks, net injections of gas into storage have exceeded 100 Bcf, with next week’s injection forecasted to carry that run to 7 of 8.
As shown in Figure 1, over the past 10 weeks, gas inventories have increased by 967 Bcf. This is over 400 Bcf more than what was injected over the same period last year and it is the most amount of gas put into storage in the last 10 years for these same weeks. The 967 Bcf of gas placed into storage is enough to fill more than 200 LNG tankers – now that’s a lot of gas!
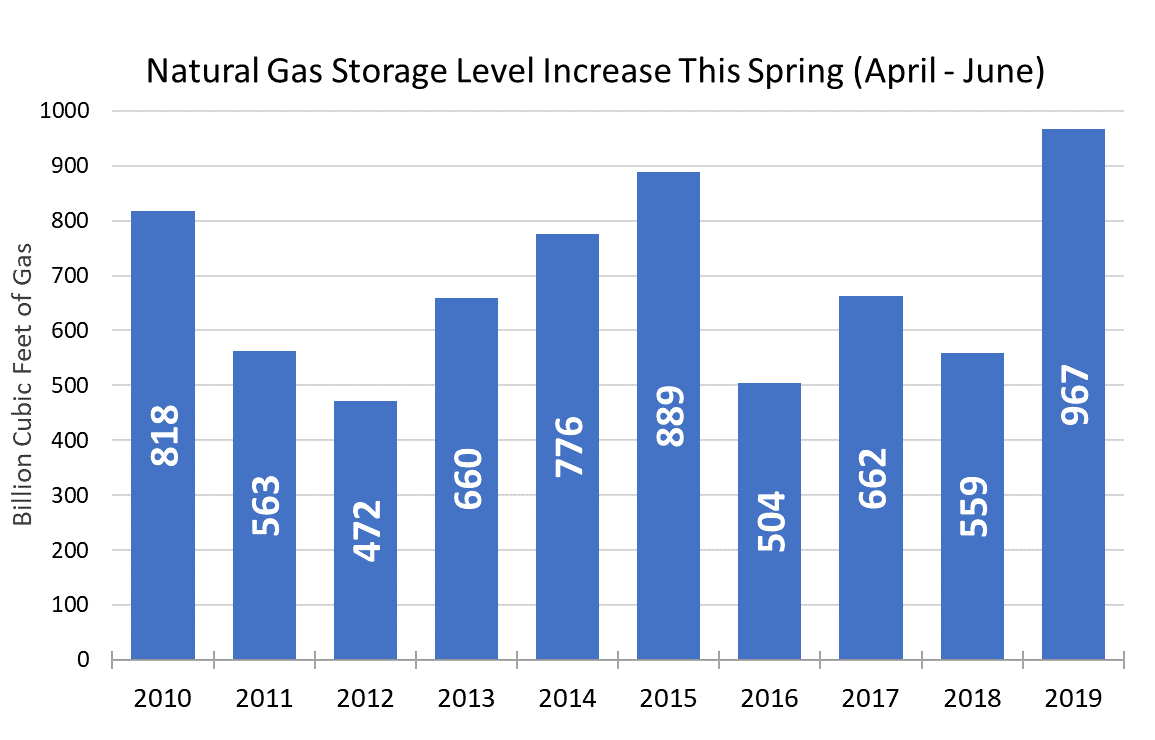 Figure 1: Natural Gas Storage Level Storage Increase This Spring Graph, by 5
These significant injections have had a major impact on gas prices for the balance of this summer and the balance of the year. Figure 2 compares the forward price for Henry Hub natural gas on May 1, 2019 (blue line) with the forward price on June 11, 2019 (black line). This chart shows the large drop in wholesale market prices for Q3 2019 through Q1 of 2020, with a smaller price decrease for all months and years beyond 2021.
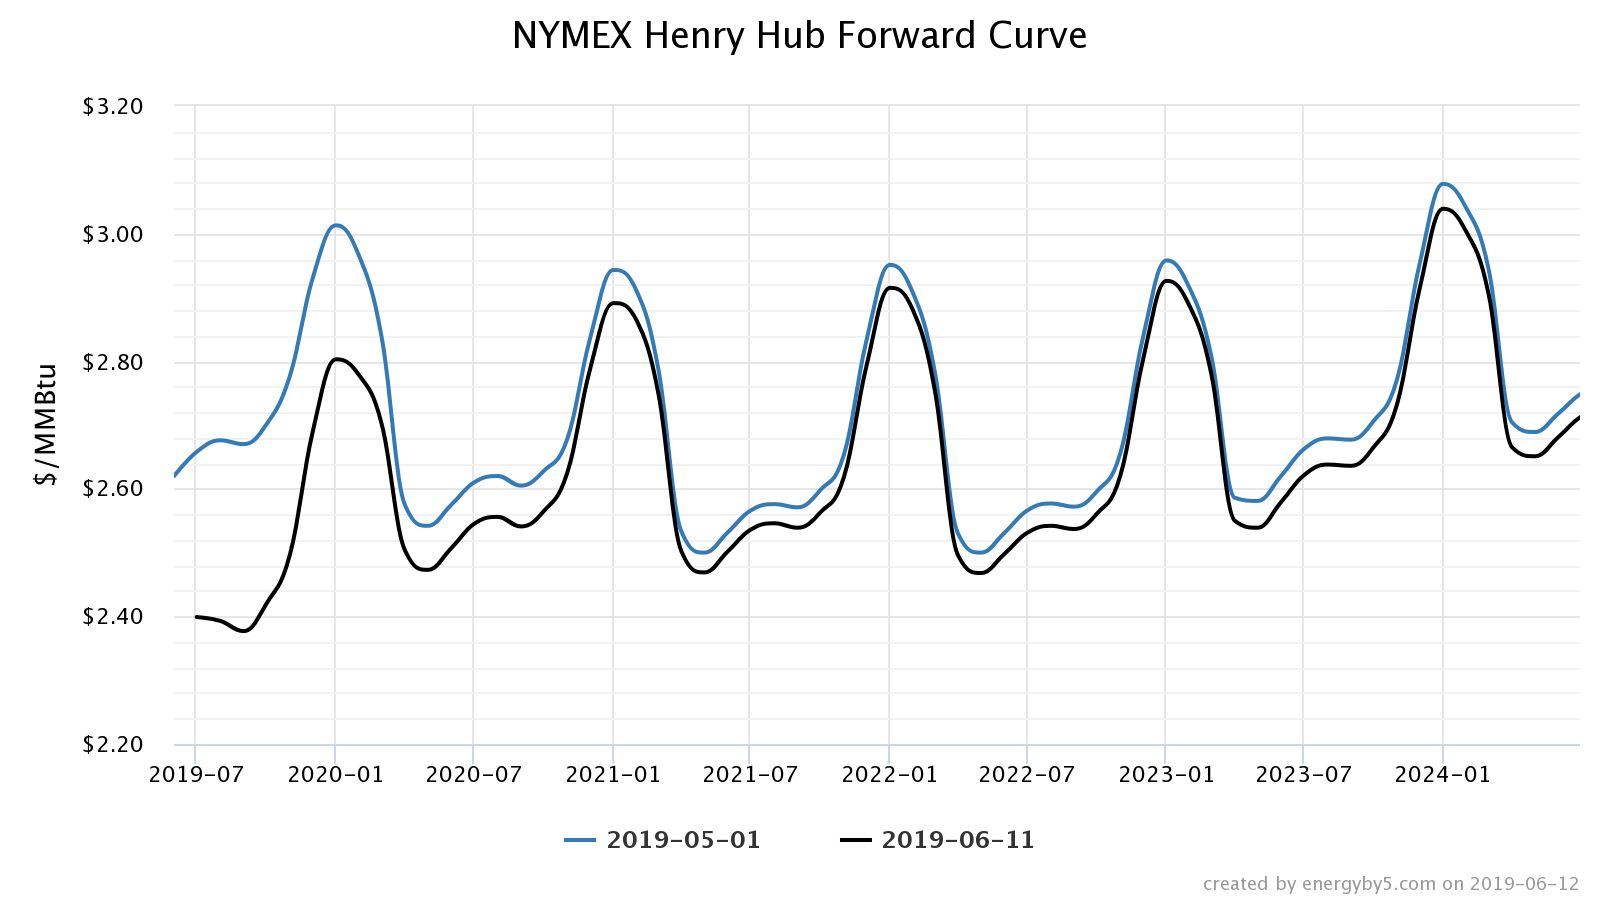 Figure 2: NYMEX Henry Hub Forward Curve Graph, by 5
Figure 3 shows that gas prices for the balance of 2019 (Jul – Dec) are at historic lows and trading below $2.50/MMBtu. Additionally, gas prices for the winter of 2020 (Jan – Mar) are also trading at their record lows of approximately $2.75/MMBtu. The significant amount of gas that is exported each week is overshadowed not only by the volume of gas being put into storage but also by the overall production capacity in this country. These dynamics are fueling the near-term downward pressure on prices for the balance of 2019 and the upcoming winter of 2019/2020. These are very strong purchasing signals; clients who need to purchase natural gas over the next 12 to 18 months should not miss the boat (pun intended), capitalize on this opportunity and consider closing out their open positions.
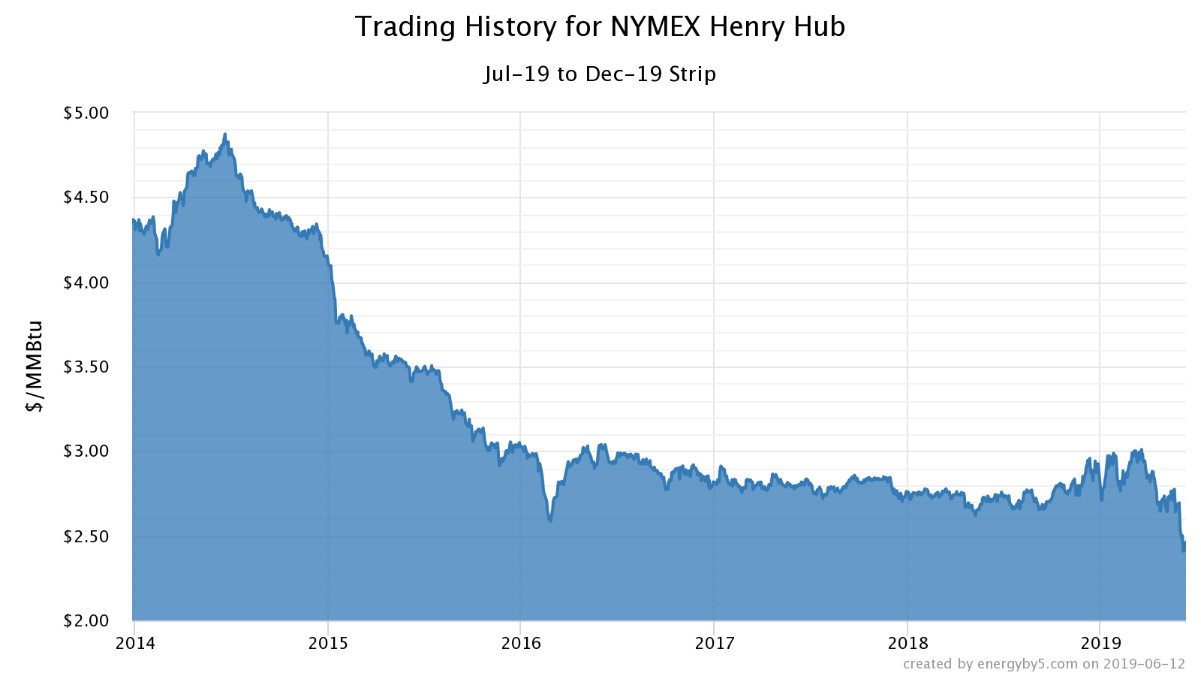 Figure 3: Trading History for NYMEX Henry Hub Graph, by 5