Once upon a time, major hurricanes in the Gulf of Mexico had the potential to wreak havoc on natural gas markets and send prices soaring to levels that are 4X what they are today. Late last month, as Hurricane Laura was heading toward major gas production centers, many were asking if gas prices would turn bullish and increase because of the impact to natural gas supplies. If this were 2005, the answer would have been a definitive “yes.” But today, the correlation of natural gas prices and hurricanes in the Gulf of Mexico is not what it was fifteen or even ten years ago. There are several reasons for this change.
1. Natural Gas Production in the Gulf of Mexico Isn’t What it Used to Be
Between 1990 and 2010, any hint of a hurricane in the Gulf of Mexico was a sure sign of rising natural gas prices. This was normal and a natural reaction to the potential shift in supply and demand that was likely caused by hurricanes. Before the wide-spread adoption of land-based horizontal drilling and hydraulic fracturing, a large amount of the nation’s natural gas supply came from wells in the Gulf of Mexico, from platforms off the coasts of Texas all the way to Alabama. When hurricanes or tropical storms were expected to pass through that region, many wells were shut-in, meaning that gas and oil stopped flowing and crews from the offshore platforms were evacuated for safety reasons. When oil and gas rigs are shut-in, it minimizes the risk of well damage and potentially uncontrollable breaks or leaks.
This reduction of supply had the potential to create dramatic swings in the supply/demand balance of the market at that time. Figure 1 shows Gulf of Mexico dry natural gas production by year, from 2001 through 2018. In 2001, the Gulf produced 5 trillion cubic feet (Tcf) of gas, or 13.8 billion cubic feet (Bcf) per day. By 2018, that rate had fallen to just over 2 Bcf per day or what is now less than 2.5% of our average daily production. Today, even a complete shutdown of all natural gas coming from the Gulf of Mexico would amount to a fractional loss of the nation’s gas supplies.
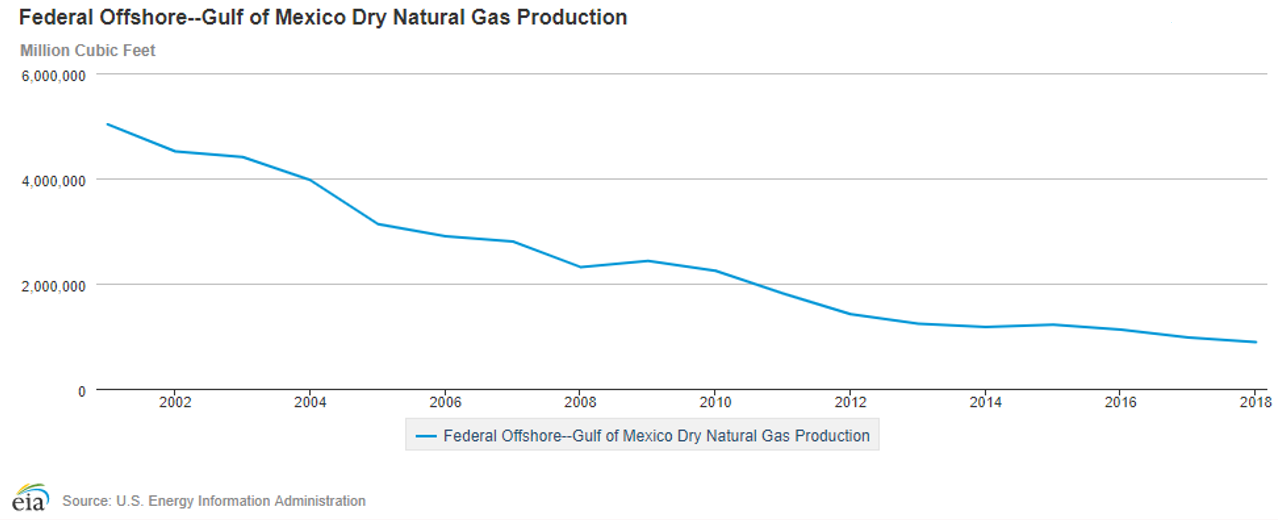
Figure 1: Federal Offshore - Gulf of Mexico Dry Natural Gas Production, from eia.gov
2. Lower LNG Exports Lead to Increased Domestic Supplies During Storms
Lately, the Gulf of Mexico is actually a larger consumer of natural gas than it is a producer. During 2019, ships containing liquified natural gas (LNG) departed the Texas and Louisiana coast carrying an average of 5.6 Bcf/day of gas to markets outside of the United States, typically traveling to Central and South America, Asia and Europe. By early 2020, prior to COVID-19, those exports had climbed to about 9 Bcf/day. During a hurricane or tropical storm, these ships cannot go to sea or safely anchor in port and load LNG onboard. The graph in Figure 2 shows the decreased throughput of natural gas at the two largest LNG export terminals in the US (Cameron in blue and Sabine Pass in light blue), both of which are located on the Gulf Coast near the Texas/Louisiana border. The yellow line shows the total aggregated daily LNG exports. As Hurricane Laura approached Cameron, LA, the closure of these two LNG terminals reduced natural gas exports by about 2.5 Bcf/day. This effectively increased domestic production by that same amount, which is more than what is produced in the entire Gulf of Mexico each day.
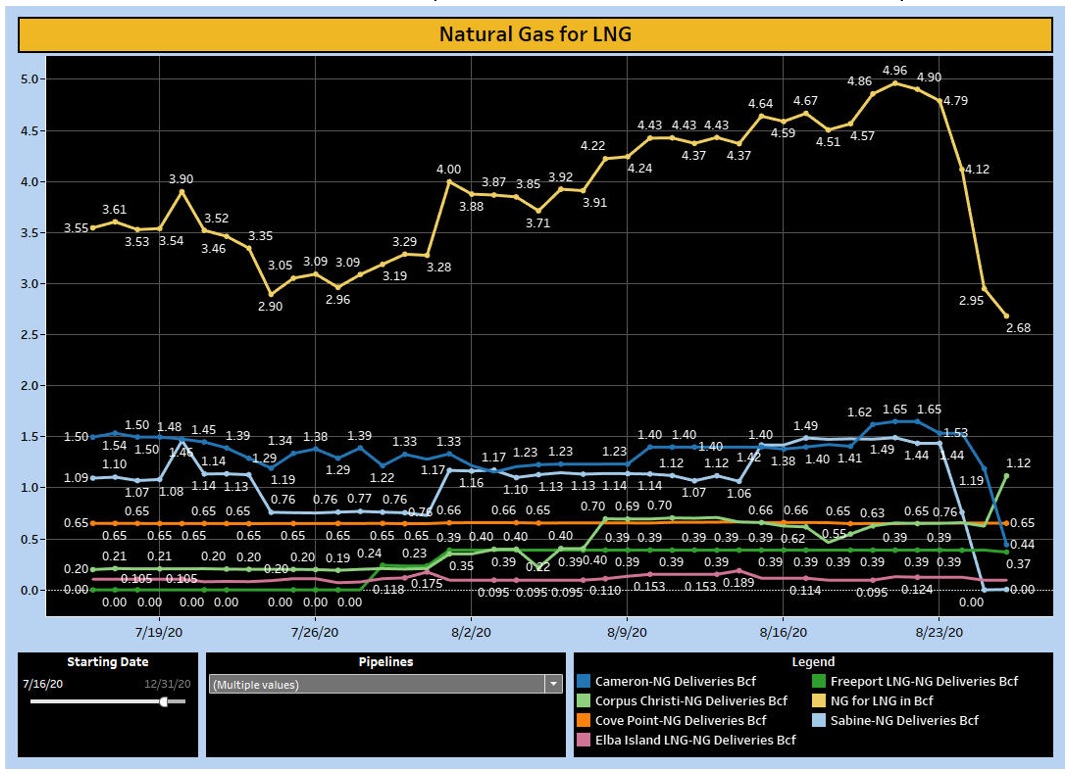
Figure 2: Natural Gas for LNG
Additionally, natural gas demand is often lower during a storm because the associated rain and clouds lower temperatures across large portions of Texas and the Southeast. These cooler temperatures, coupled with demand destruction from power outages, reduces demand for electricity which often comes from natural gas fired power plants, further reducing natural gas consumption.
Hurricane Laura’s Effect on Natural Gas Forward Prices
Hurricane Laura was a Category 4 storm and the strongest hurricane to hit Louisiana since 1856. It was the tenth strongest hurricane, measured by windspeed, to make landfall in the US and took aim right at the Texas/Louisiana border on Thursday, August 27th. Figure 3 shows how prices for the October gas contract changed as Hurricane Laura approached; the red and green bars indicate a decrease and increase, respectively, in futures prices. On Tuesday (8/25) and Wednesday (8/26), as the storm approached Cameron, LA, natural gas prices fell slightly, due to the risk of catastrophic storm surge and potential damage to its large LNG export terminals. Later, during the trading session of August 27th, as traders began to realize that the storm damage to the two LNG facilities was minor, the markets quickly recovered their losses from the previous two sessions. And within three days of the storm, the market had returned to where it was prior.
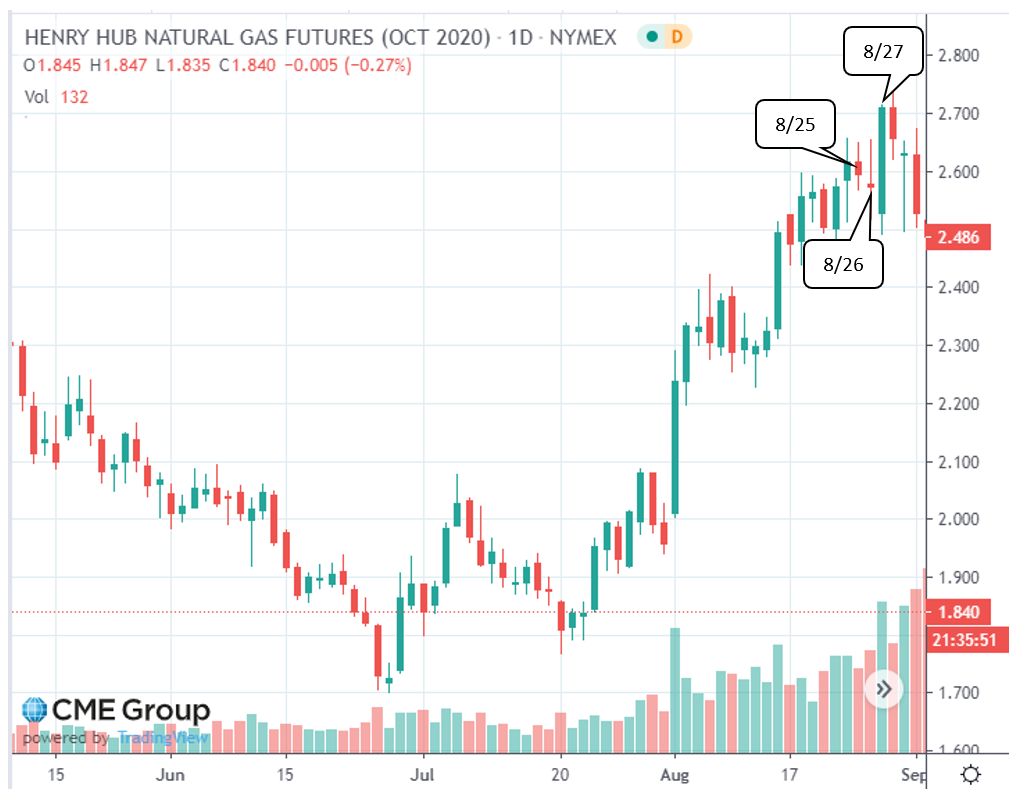
Figure 3: Henry Hub Natural Gas Futures (Oct 2020), from cmegroup.com
Compare these results to the aftermath of first Hurricane Katrina near the Louisiana/Mississippi border and then Hurricane Rita near the Texas/Louisiana border, during August and September of 2005. Hurricane Rita made landfall in essentially the same location as Hurricane Laura, but instead of moving natural gas prices by a nickel or two a day, she drove that year’s October natural gas price up to $13.907 per MMBtu. The dramatic effect of these storms on natural gas prices is shown below in Figure 4. This chart shows that the hurricane season of 2005 produced the NYMEX’s two highest priced months in the market’s history. Ironically, 2020 is only the second time in history that the Atlantic Hurricane Season has completed the alphabet of predetermined storm names and is now into the Greek letter names, with 2005 being the first. Oh, how times have changed.
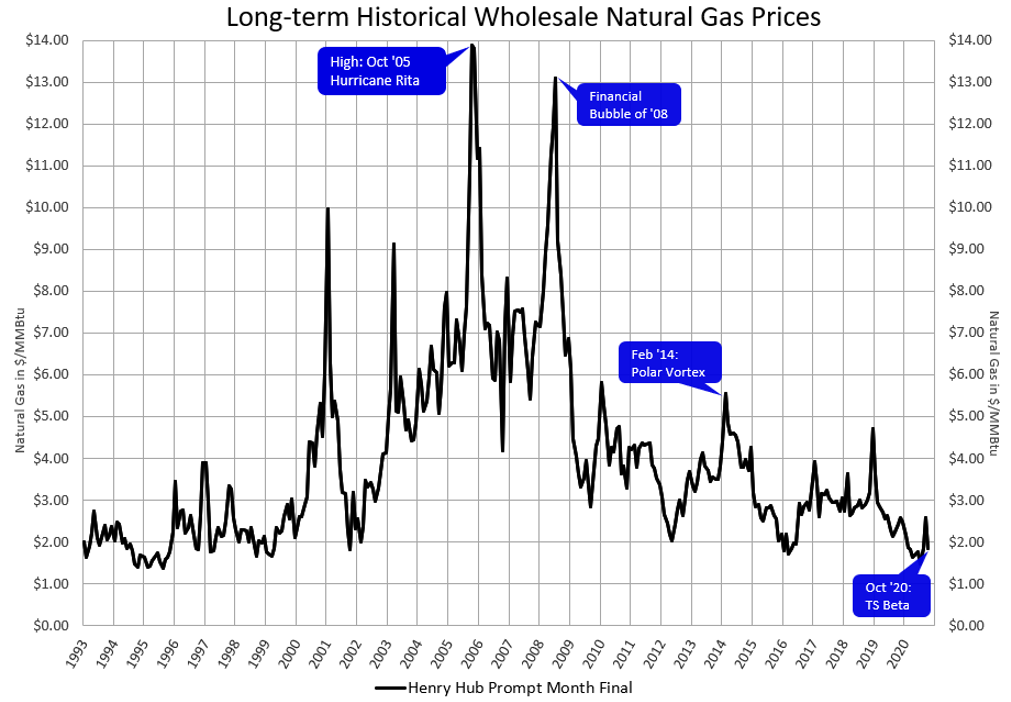
Figure 4: Long-Term Historical Wholesale Natural Gas Prices, from 5