
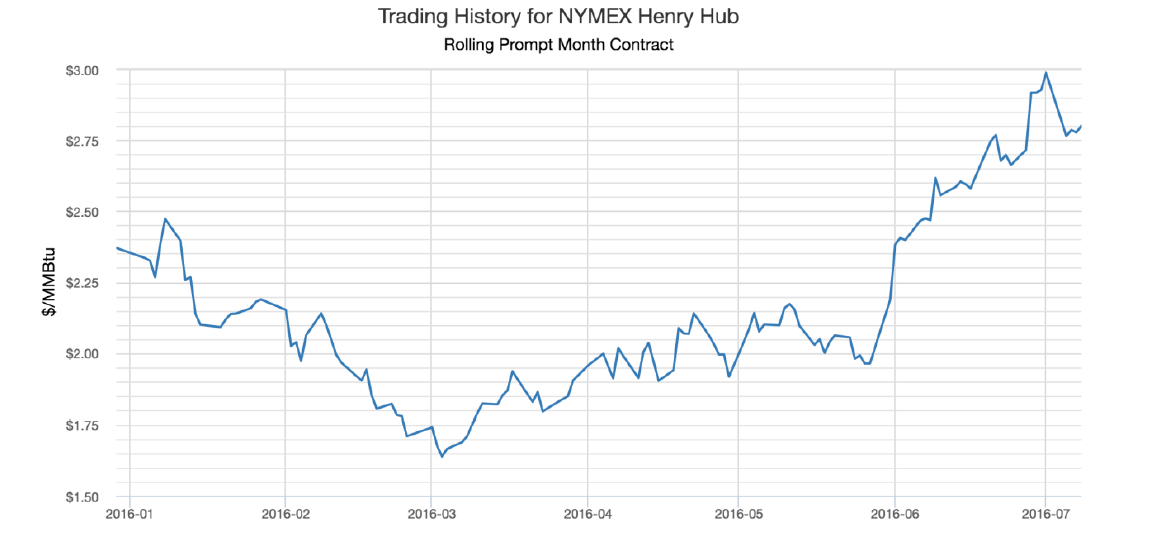
On behalf of the entire team at 5, I am pleased to forward our market letter for the second quarter of 2016. Q2 marks the end of a long period of relatively flat and/or decreasing electricity and natural gas prices. The recent reversal is well represented by the following chart, which shows how prompt month natural gas has traded over the past 6 months.
Source: energyby5.com
Prompt month gas has risen approximately 70% since its low of $1.639 per MMBtu on March 3rd. At this point, the natural gas rally is primarily in 2016 and 2017. From 2018 forward the price of natural gas has remained relatively flat. This market structure allows clients to hedge calendar years 2018, 2019 and 2020 at or below near term prices. We do not expect this backwardation to continue for very long, and we encourage clients with open positions to consider taking advantage of this immediate market opportunity.
Source: energyby5.com
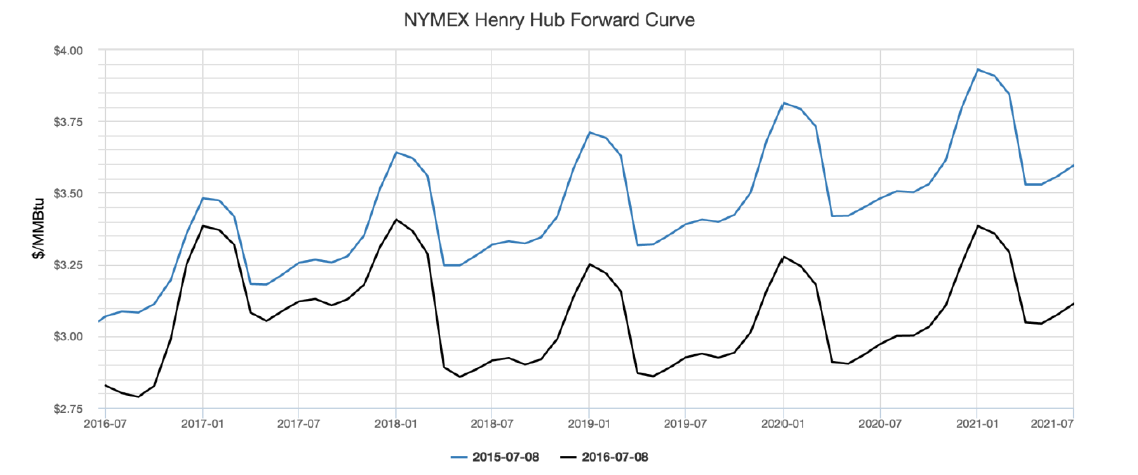
The graph above shows the NYMEX Henry Hub forward curve as of one year ago compared to the latest market close. The significant decline in calendar years 2018 and beyond is very clear. But near term prices stand only marginally lower than where they were a year ago due to the recent rally.
While there is no definitive reason for the recent rally, looking back over the second quarter we see several market events that support an increase in natural gas prices as well as others that support a decline. Two recent events that could put upward pressure on natural gas prices are: (i) the commencement of LNG exports from the continental United States, and (ii) the rapid expansion of gas exports to Mexico. Although the link between these events and the recent rally is indirect, they merit additional discussion.
US LNG Exports Commence
On February 24, 2016, the LNG tanker Asia Vision departed Cheniere Energy’s Sabine Pass facility bound for Brazil with 3 billion cubic feet of liquefied natural gas. Cheniere’s history reminds us how fast the energy market can change. In 2008, Houston based Cheniere (among others) believed that the US was almost certain to run out of natural gas. For this reason, they started to develop import facilities to receive LNG and convert it into natural gas.1 When the shale boom turned the natural gas shortage into a surplus, Cheniere was left with a relatively worthless investment in massive storage tanks and other infrastructure built to support LNG imports. The CEO of Cheniere said “I built a $2 billion facility to import, and there were no imports.” Cheniere pivoted.
Instead of using the tanks and other infrastructure to support LNG imports, they developed a facility to export natural gas from the US to markets around the world. Cheniere secured long term LNG export contracts with key natural gas traders including Total, Korea Gas, Spain’s Fenosa and the UK’s Centrica.
As natural gas prices continued to decline in the US, they increased dramatically in Europe and Asia. Given this significant arbitrage, the market began to believe in Cheniere’s new plan. Cheniere’s stock, which was trading in the single digits back in 2008, quickly topped $20 a share by 2013 and is currently around $38 a share.
When Cheniere began exporting LNG in February, some commentators noted that linking the commencement of LNG exports to a reversal in natural gas prices was “like howling at the moon and expecting it to move.” Yet the correlation between the export of LNG and the rise in the price of natural gas suggests that this time howling might have worked. Bloomberg links the recent turnaround in natural gas prices to increasing volumes of natural gas being exported from Sabine Pass. The following chart shows how the rise in gas prices correlates to exports from Sabine.
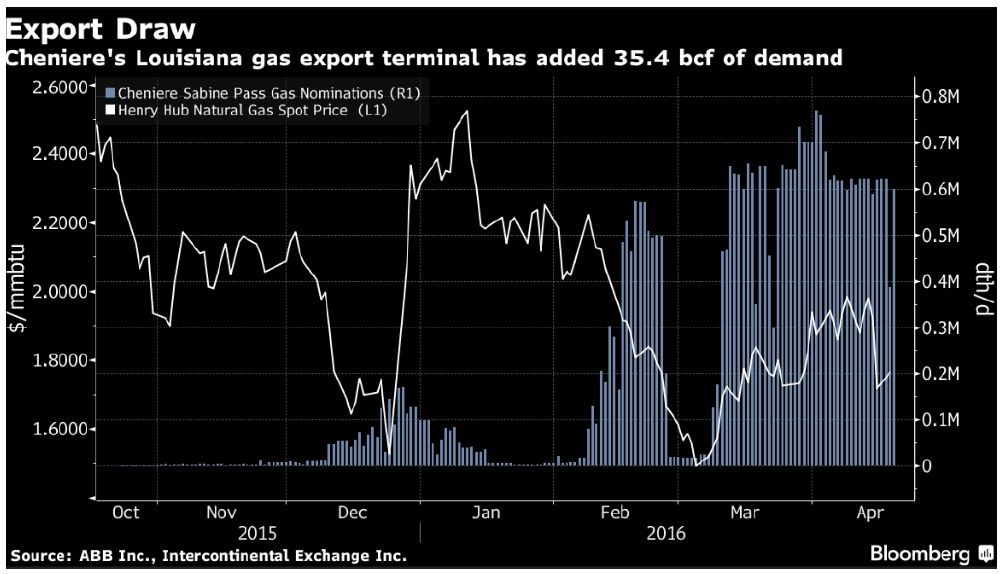
To be clear, the Cheniere export volumes are not sufficient to change market fundamentals. But markets can be moved by many factors. The commencement of LNG exports may have contributed to a fundamental shift in the market’s psychology – from bearish to bullish. Several other LNG export facilities in Maryland, Louisiana and Texas will soon join Cheniere in sending US natural gas to foreign markets. In addition, Cheniere is planning to significantly expand the export capabilities of its Sabine Pass facility and another 20 export facilities are at various stages of development.
In addition, the export of LNG may significantly increase the short term volatility in US natural gas prices. LNG purchasers are not energy traders; they are end use customers in Latin America, Europe and Asia. If the purchasers were energy traders (e.g. Goldman Sachs) and the price of natural gas spiked next winter, the traders would resell the purchased gas back into the US market and realize a significant windfall. End users like the Government of Japan need the LNG to keep the lights on and will not redirect volumes even if they can realize a significant trading profit. If we experience a short term natural gas delivery shortage next winter, volumes committed to export will continue to flow out of the country even if the market price supports redirecting such volumes to shortages in the US market.
Natural Gas Exports to Mexico
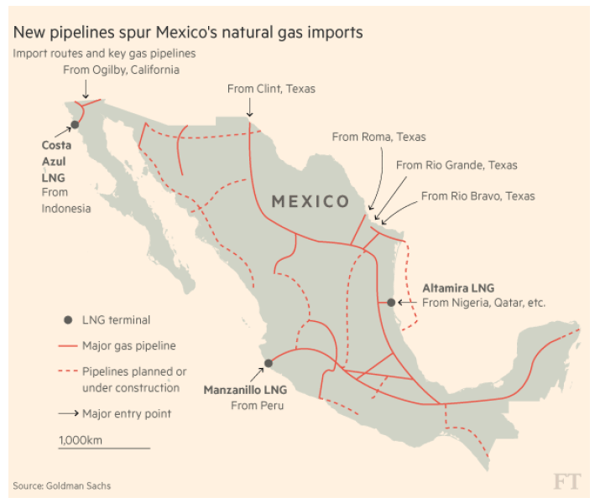
As discussed last year, the deregulated Mexican energy market presents a significant new opportunity for a wide variety of international energy developers, including exporters of natural gas. Investments in natural gas pipelines linking Mexico and the US have accelerated since the Mexican energy market opened up. A US/Mexican joint venture recently finished the first phase of the Roadrunner pipeline, which links the Permian basin of West Texas to Mexican markets. This summer, the Los Ramones II pipeline should begin delivering pipeline gas from the Texas Eagle Ford Shale (South Texas) to Mexico City. Another new pipeline plans to move gas from Texas under the Gulf of Mexico to Veracruz. Platts forecasts that these and other projects will more than double pipeline capacity between the US and Mexico. As the following graphic demonstrates, these projects could move a significant amount of gas.
While the export of a significant volume of natural gas and new pipelines to Mexico should have a bullish impact on natural gas prices, many other recent market developments are likely to have a bearish impact on the natural gas prices. These include:
- Australian LNG Exports: In March, Australia commissioned one of the world’s largest LNG terminals in North Western Australia. If all of Australia’s other planned projects are developed, the US EIA estimates that Australia’s LNG export capacity would grow to the largest in the world, 11.5 Bcf/day, approximately 1/3rd of the world’s LNG total LNG trade
in 2014. - A Decline in the Price of LNG in Asia: Asian LNG, which traded as high as $15/MMBtu is
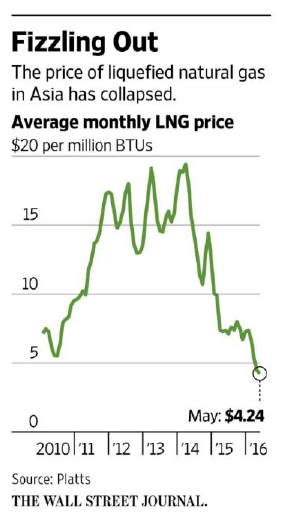 now trading under $5 MMBtu. If this trend continues, we may see a large number of planned projects cancelled.
 - Renewable Energy Projects: Utility scale wind and solar farms are now winning competitive bids against new gas fired generators. The CEO of Italian energy giant Enel, speaking on CNBC, noted renewable energy’s ability to win unsubsidized bids in several markets. For example, Brazil has been running auctions for new generation and awarding contracts to the low price bidder, regardless of technology, since 2009. In 75% of the cases, wind generation assets bid at prices below natural gas. Gas fired generation won only 7% of the bids. We see the same pattern in Mexico. Enel (among other bidders) won projects to supply 1,000 MWs of solar at prices that gas fired generation cannot touch. While incentives are still important in the US (where we have an abundant supply of low cost natural gas), in other markets renewables compete on price alone, and we may see this trend accelerate over time. This will continue to put downward pressure on natural gas pricing.
- Japan’s Reversal on Nuclear Power: In the wake of the 2011 Fukushima nuclear failure, Japan effectively shut down all of its nuclear reactors – taking approximately 30% of the electric generation capacity off the grid. The reactor shutdown significantly increased Japan’s demand for imported LNG. With a change in government in 2014, Japan began efforts to restart its nuclear plants. The government now hopes to use nuclear power to produce 20% of its electricity by 2030. If Japan is successful in restarting its nuclear capacity, demand for LNG will decline.
As noted above, we are not sure what is moving the near term price of natural gas. We are sure, however, that the forward price of natural gas and electricity is still at or near historical lows. If we have a very hot summer, or supply issues next winter, we are confident that the forward price of natural gas and electricity could rise dramatically for calendar year 2018 and beyond in a manner similar to the rally we have seen in near term prices.
PJM Capacity
In May of this year PJM, the independent system operator for a portion of the mid-west and Mid-Atlantic electricity markets, announced the results of its capacity auction for the 2019/20 delivery year. Capacity auctions are run three years in advance, so while the latest results won’t be felt immediately they will certainly impact costs for millions of consumers in the years to come. The latest auction results were a significant surprise to market participants and observers.
The Shift to Capacity Performance
This was the second auction that included two types of capacity: base capacity and capacity performance. As we noted last year, capacity performance was created to address shortages in power experienced during the polar vortex of 2013/14. For a unit to bid as a capacity performance resource, it must be available every time the grid operator calls the unit. Base capacity does not include these strict performance standards. For the 2019/20 auction 80% of the capacity procured was capacity performance and 20% was base capacity. Starting with the 2021/22 auction taking place next spring, 100% of capacity must meet the new stricter performance standards.
The first auction to include capacity performance took place in August and September of 2015. As expected, the capacity performance requirements caused the price of capacity to go up significantly. 5, and most market commentators, expected this trend to continue with this year’s auction. Yet when the auction results were announced on May 24th, we saw just the opposite. Capacity prices decreased. Most of PJM capacity cleared at prices 39% lower than the prior year and eastern portions of PJM cleared 47% lower. Consulting firm ICF analyzed these results and found several interesting drivers, including (i) a reduction in energy demand, (ii) significant amounts of new generation capacity bidding in the market, and (iii) new generation plants bidding at significantly lower prices.
- Demand Reduction: PJM reduced forecasted market demand for 2019/2020 by approximately 3% (4 GWs). Prior to this auction, PJM did not modify their forecast of future market demand by reductions (from consumer actions such as energy efficiency projects and on-site solar) anticipated to occur between the auction date and the capacity period (three years later). By previously not including forecasted reductions in demand it caused PJM to overestimate energy demand. Now PJM’s demand forecast includes both actual and forecasted demand reductions.
- Significant Amounts of New Capacity: 5.5 GW of new capacity (generation) participated in the auction. This represents a significant amount of new supply.
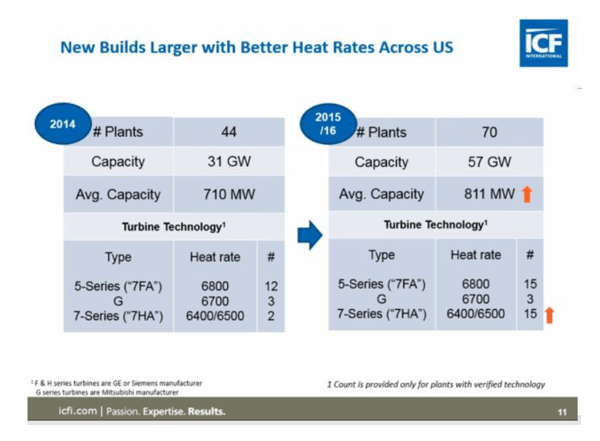
- New Capacity Accepts Lower Capacity Revenue: Almost all of this new capacity was high efficiency gas generation located at or near low cost supplies of natural gas. Not only did the presence of additional generation soften capacity prices, these units were larger and more efficient than current units. The bulk of this new capacity operates using 7 Series turbines. As the chart below demonstrates, these units operate at much lower heat rates (higher efficiency) than older machines. In addition, the average size of the units is larger so the per unit operating cost is also lower. ICF’s analysis concluded that these new machines can operate at a profit at $100 MW/Day.
The auction results meant lower prices and lower incentives to build. Longer term, the results call into question the viability of a significant amount of PJM’s coal and nuclear generation and demand response resources. When capacity markets were introduced, some regulators (and many owners of generation) argued that we needed the certainty of capacity revenue to offset the volatility of energy revenue. The recent auction demonstrates that capacity markets are volatile as well.
More importantly, at current prices, the units that the capacity market were designed to help – older coal and nuclear units – bid too high to qualify for capacity payments. In the most recent auction, some 7,210 MWs of coal capacity did not clear and 4,534 MWs of nuclear capacity did not clear. As a result, instead of incentivizing the continued operation of these units for reliability purposes, the auction generated a growing list of planned retirements.
The Trouble with Eliminating Base Capacity
Defining capacity as capacity performance deters the development of demand response and other intermittent resources. Historically, PJM has relied on a broad range of these resources to meet energy needs. To qualify for capacity performance payments, a demand response resource must be available year around. If you can only reduce air conditioning load in the summer or heating load in the winter, you do not qualify. Similarly, intermittent wind and solar resources (which operate only when there is wind or sun) cannot qualify.
Let’s take the example of a client (a country club) that historically participated in demand response by offering to shut down golf course pumps and air conditioning on peak days in the summer, and indoor tennis court heaters in the winter. These demand response resources cannot meet the definition of capacity performance. By disqualifying them entirely, PJM has lost the benefit of these resources during summer or winter emergency events. In the most recent auction, 10,248 MWs of demand response cleared the auction. Of that amount, only 614 MWs was capacity performance. For next spring’s capacity auction, all capacity must be capacity performance. Again, we expect to see a significant increase in these capacity prices next spring.
It appears that current capacity pricing and capacity performance restrictions will limit the amount of demand response resources participating in the market. Capacity performance will also make it more difficult for less efficient coal and gas units to continue to operate.
PJM is aware of these shortcomings and is investigating further modifications to its capacity rules. It is hard for us to predict how changes in the natural gas and capacity markets will play out over time but one thing remains clear, we will continue to see significant uncertainty in the structure of the electricity and natural gas markets for years to come.
1 In order to transport natural gas overseas, it must be cooled and converted to a liquefied form. Similarly, when LNG is imported, it must be heated to be converted back into natural gas for shipment through natural gas pipelines.